3차원 공간에 파이썬을 이용해 주식가격의 변동을 기록한 그래프를 그리는 프로그램을 작성해보았습니다.
일단 주식가격에 대한 데이터를 주기적으로 크롤링 해 와서 데이터베이스에 저장을 해 두는게 필요합니다.
파이썬과 데이터 베이스 연계를 아직 안해보셨다면 아래 링크를 먼저 확인해주세요.
python 에서 pymysql 이용해 mysql과 연결하기, CRUD 예제
일단 MYSQL이 설치되어 있지 않다면 설치 및 초기 설정이 필요합니다. shanepark.tistory.com/41 mac) MYSQL 설치 및 초기설정하기 HOMEBREW 패키지 설치를 이용해 설치하는게 가장 간단합니다. [ homebrew가 설치
shanepark.tistory.com
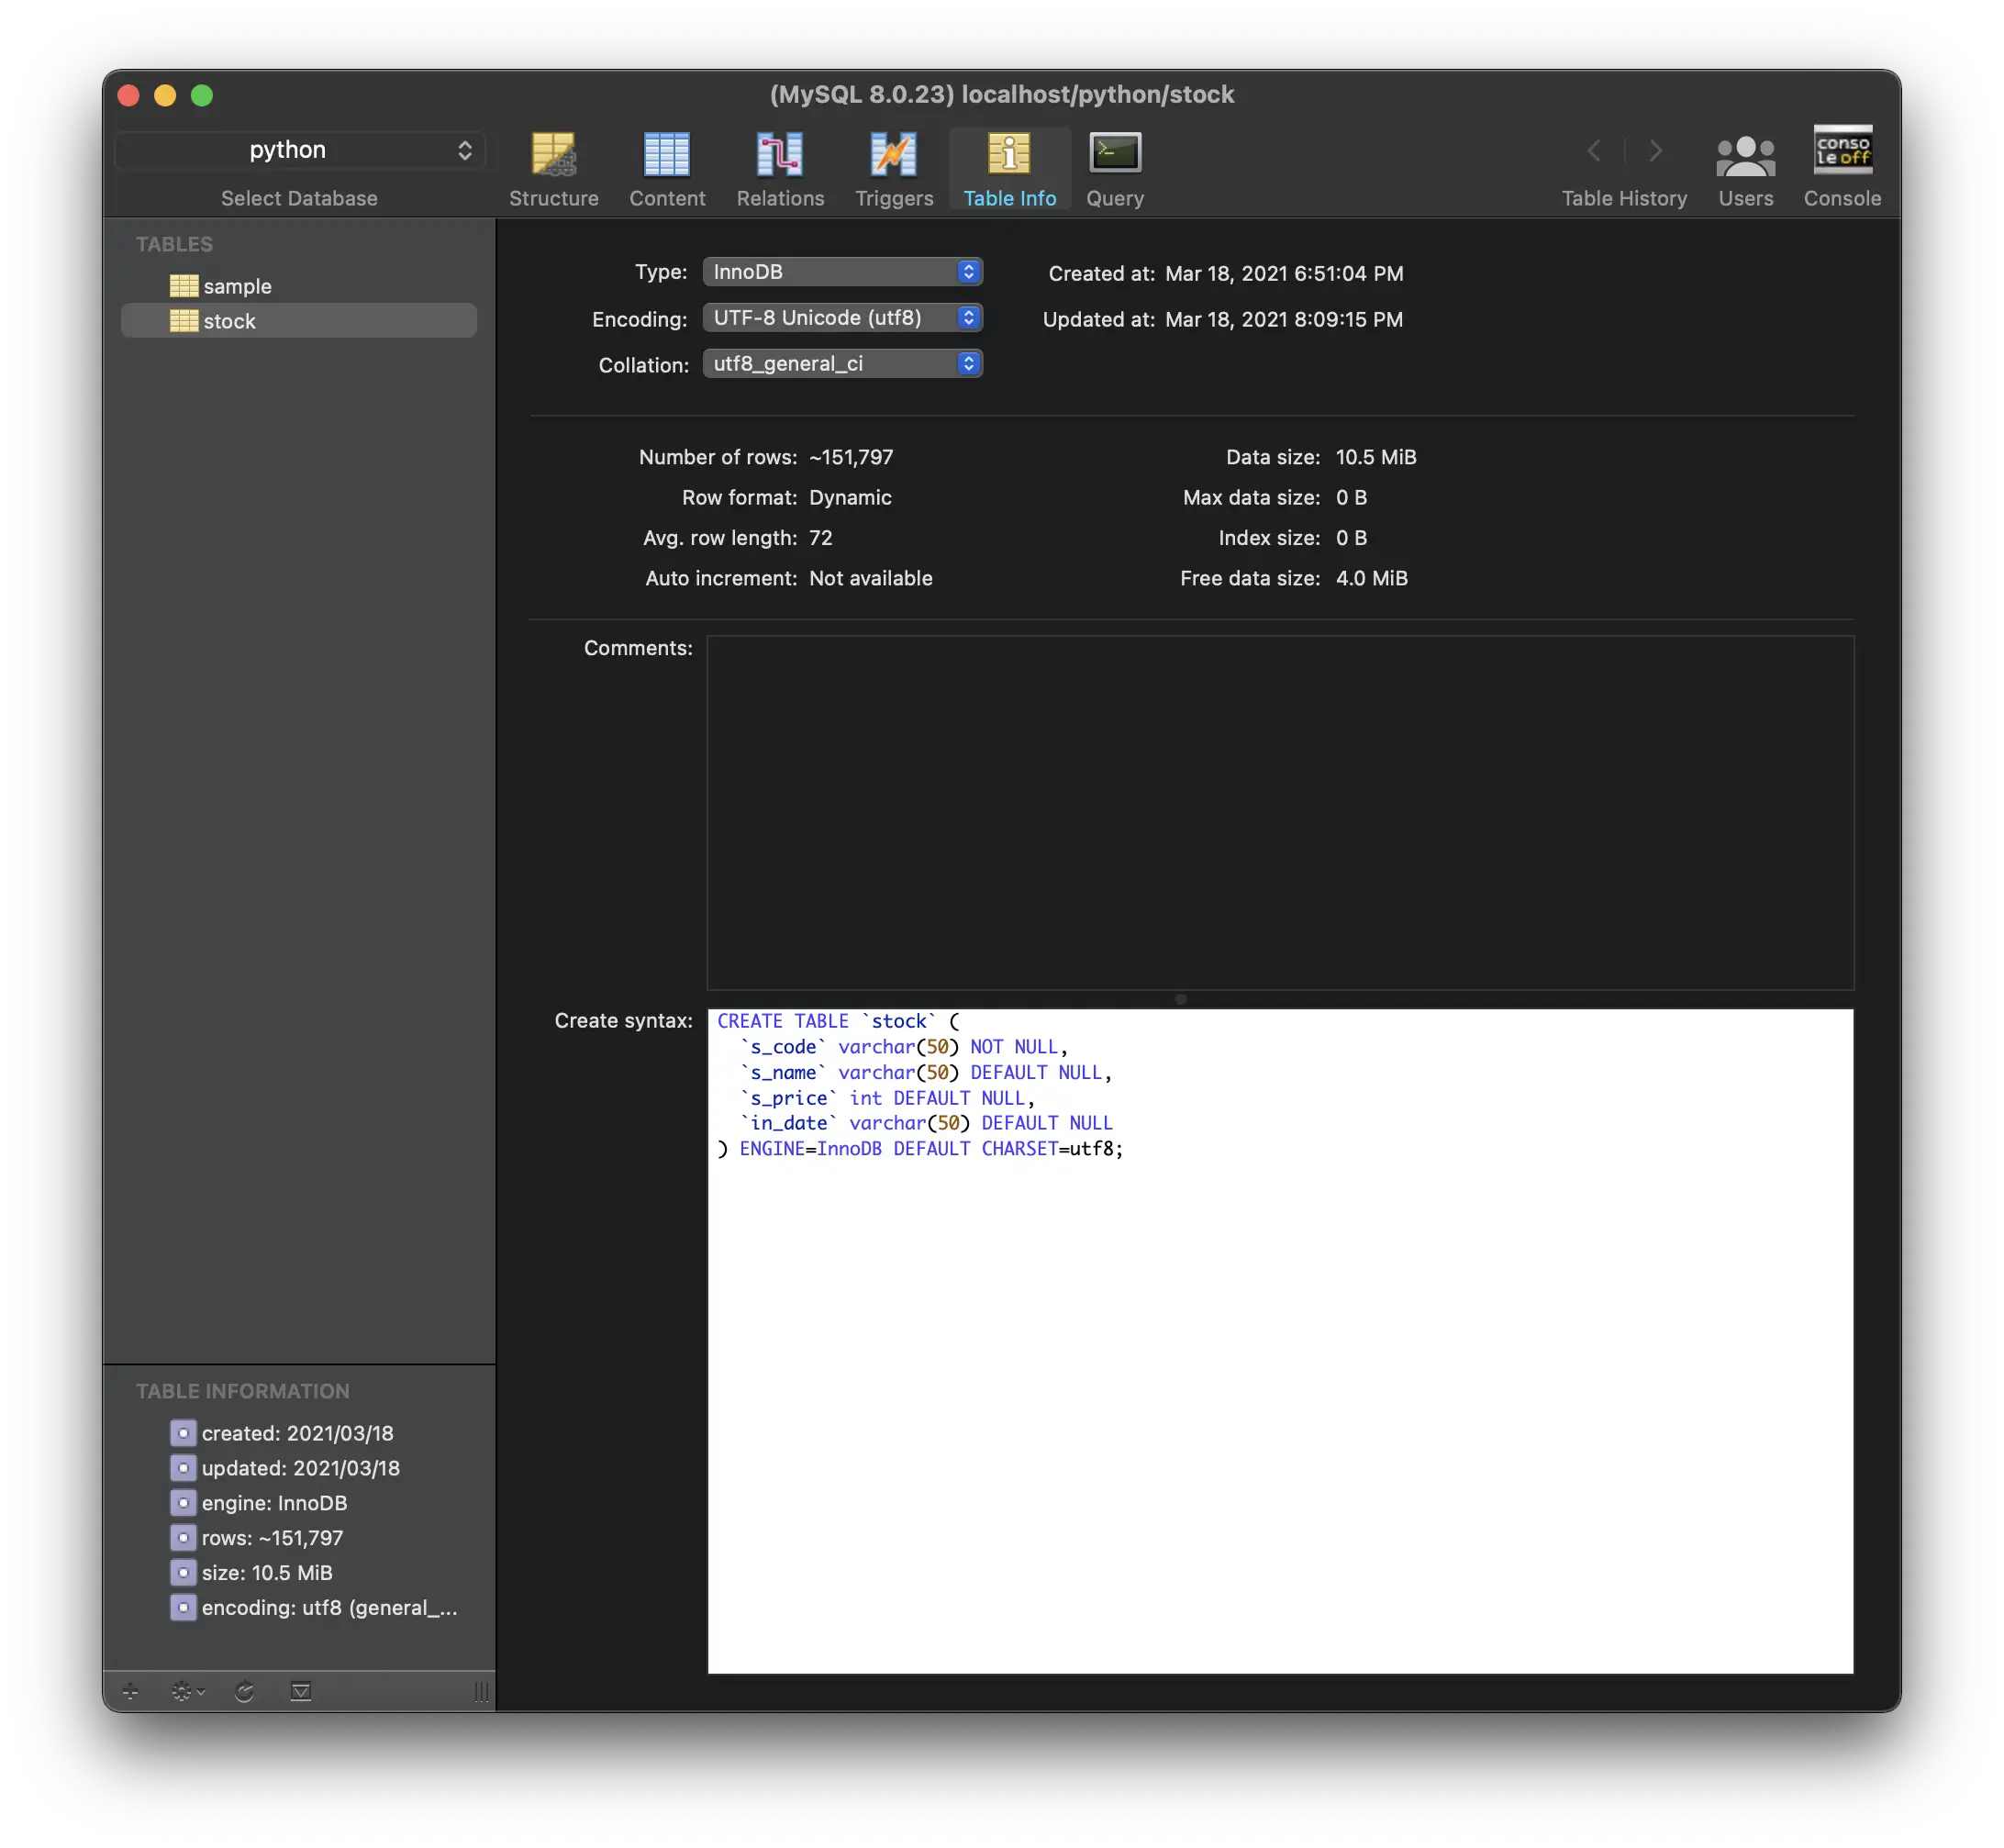
- 첫번째로 MYSQL에 python 이란 DB에 stock 이란 테이블을 만들어 두어야 합니다.
routeros
routerosCREATE TABLE `stock` ( `s_code` varchar(50) NOT NULL, `s_name` varchar(50) DEFAULT NULL, `s_price` int DEFAULT NULL, `in_date` varchar(50) DEFAULT NULL ) ENGINE=InnoDB DEFAULT CHARSET=utf8;
- 해당 테이블에 크롤링해오는 주식 데이터들을 주기적으로 insert 해줍니다.
아래 코드는 10초에 한번씩 총 60번을 기록한 뒤 종료합니다. 1분 간격으로 두어시간 정도 기록을 하면 데이터가 제법 쓸만 할 듯 합니다.
pgsql
pgsqlfrom datetime import datetime import time from bs4 import BeautifulSoup import pymysql import requests db = pymysql.connect(host='localhost', user='root', db='python', password='python', charset='utf8') curs = db.cursor() for i in range(60): response = requests.get('https://www.sedaily.com/Stock/quote') txt = response.text soup = BeautifulSoup(txt, 'html.parser') count = 0 timevar = datetime.now().strftime("%Y%m%d%H%M%S") for info in soup.select('.tbody'): count += 1 name = info.dt.text price = int(info.dd.span.text.replace(",","")) stockId = info.dd['id'] stockId = stockId[-6:len(stockId)] sql = ''' insert into stock (s_code, s_name, s_price, in_date) values('{0}','{1}',{2},{3} ) '''.format(stockId,name,price,timevar) curs.execute(sql) print("{0}개 column 등록 완료, {1}번 반복 완료.".format(count,i+1)) db.commit() time.sleep(10) db.close() print("프로그램 종료")
- 이제 데이터 베이스에 저장된 데이터들을 가지고 그래프를 그려봅니다.
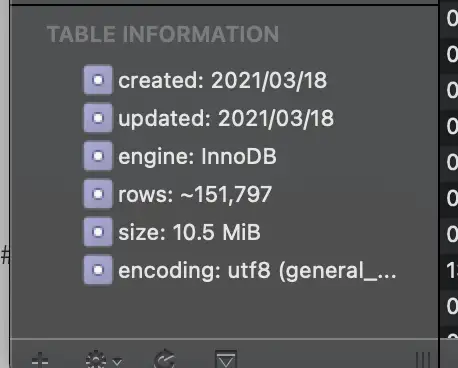
 테이블에 약 15만개의 rows 가 등록되었습니다.
저는 몇 가지 단계를 거쳐서 그래프 그리는 프로그램을 작성했습니다.
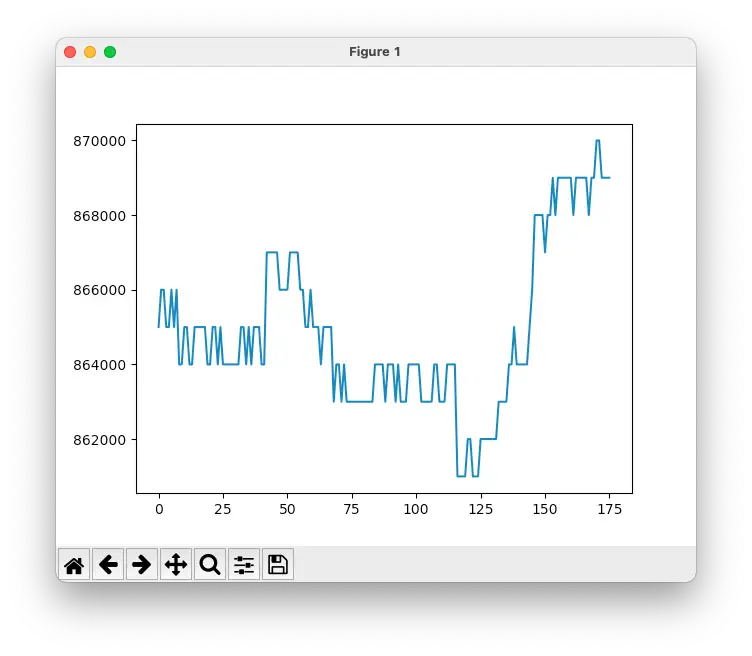
- 단일 종목을 2차원 그래프에 그려보기
pgsql
pgsqlimport re import pymysql import matplotlib.pyplot as plt db = pymysql.connect(host='localhost', user='root', db='python', password='python', charset='utf8') curs = db.cursor() sql = "select s_price from stock where s_name = 'LG화학' order by in_date desc"; curs.execute(sql) rows = curs.fetchall() x = [] price_arr = [] for i in range(len(rows)): price = int(re.findall('\d+',str(rows[i]))[0]) price_arr.append(price) x.append(i) db.commit() db.close() plt.plot(x, price_arr) plt.show()
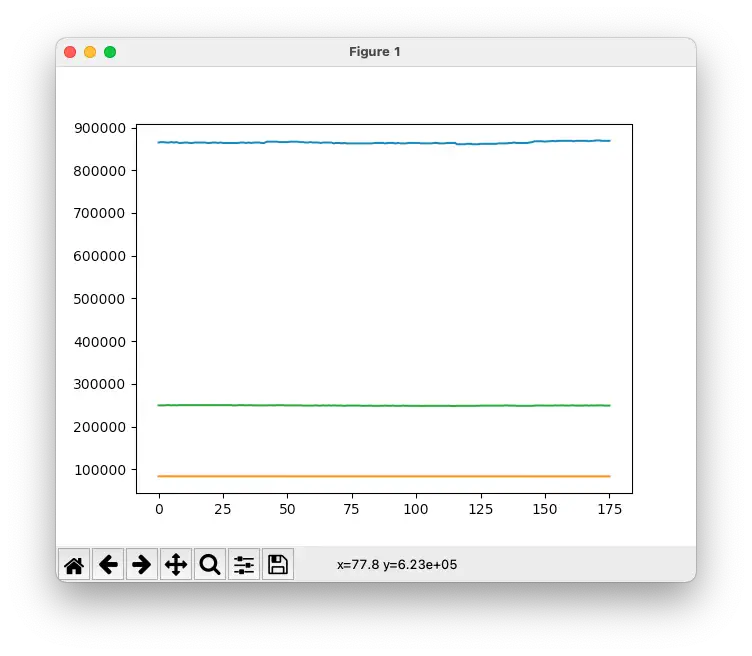
- 삼성, LG화학, SK 세 종목의 주가를 2차원 그래프에 그려보기
pgsql
pgsqlimport re import pymysql import matplotlib.pyplot as plt db = pymysql.connect(host='localhost', user='root', db='python', password='python', charset='utf8') curs = db.cursor() x = [] sql = "select s_price from stock where s_name = 'LG화학' order by in_date desc"; curs.execute(sql) rows = curs.fetchall() price_lg = [] for i in range(len(rows)): price = int(re.findall('\d+',str(rows[i]))[0]) price_lg.append(price) x.append(i) sql = "select s_price from stock where s_name = '삼성전자' order by in_date desc"; curs.execute(sql) rows = curs.fetchall() price_sam = [] for i in range(len(rows)): price = int(re.findall('\d+',str(rows[i]))[0]) price_sam.append(price) sql = "select s_price from stock where s_name = 'sk' order by in_date desc"; curs.execute(sql) rows = curs.fetchall() price_sk = [] for i in range(len(rows)): price = int(re.findall('\d+',str(rows[i]))[0]) price_sk.append(price) db.close() plt.plot(x, price_lg, x, price_sam, x, price_sk) plt.show()
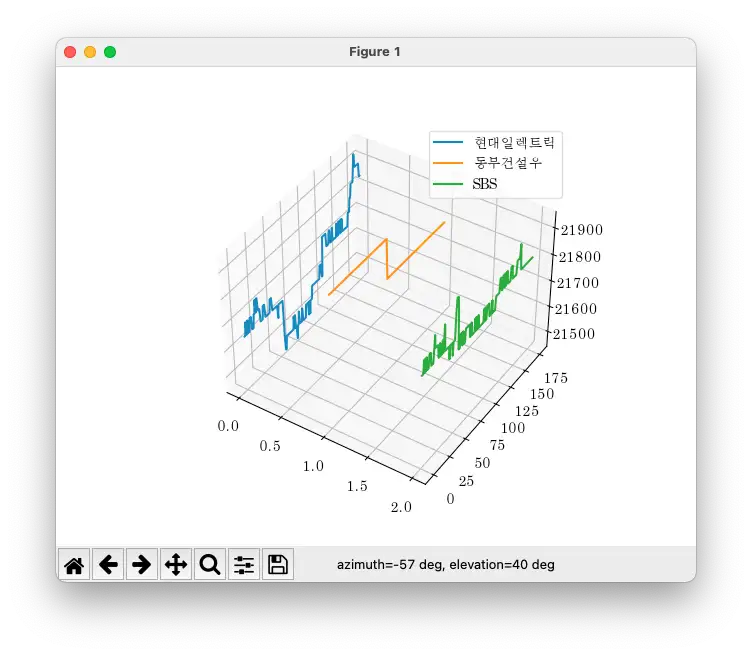
- 3개 종목을 3차원 그래프에 그려보기
아래 코드에서
python
pythonfont_location = '/System/Library/Fonts/Supplemental/AppleMyungjo.ttf'Copy
이부분을 본인이 원하는 한글 코드의 경로로 변경하셔야 합니다. mac 사용자라면 따로 변경 안하시고 코드 그대로 가져가셔도 문제 없이 잘 되겠지만, windows 환경이라면 반드시 변경을 해주셔야 합니다.
font_location = 'c:/Windows/Fonts/malgun.ttf'
맑은 고딕 폰트경로인데, 테스트는 안해봤지만 윈도우 환경에서는 위 경로로 하면 잘 될듯 합니다.
pgsql
pgsqlimport re import pymysql import matplotlib as mpl import matplotlib.pyplot as plt import matplotlib.font_manager as fm import numpy as np stock1 = '현대일렉트릭' stock2 = '동부건설우' stock3 = 'SBS' fm.get_fontconfig_fonts() font_location = '/System/Library/Fonts/Supplemental/AppleMyungjo.ttf' font_name = fm.FontProperties(fname=font_location).get_name() mpl.rc('font', family=font_name) db = pymysql.connect(host='localhost', user='root', db='python', password='python', charset='utf8') curs = db.cursor() time = [] sql = "select s_price from stock where s_name = '{}' order by in_date desc".format(stock1); curs.execute(sql) rows = curs.fetchall() price_one = [] for i in range(len(rows)): price = int(re.findall('\d+',str(rows[i]))[0]) price_one.append(price) time.append(i) sql = "select s_price from stock where s_name = '{}' order by in_date desc".format(stock2); curs.execute(sql) rows = curs.fetchall() price_two = [] for i in range(len(rows)): price = int(re.findall('\d+',str(rows[i]))[0]) price_two.append(price) sql = "select s_price from stock where s_name = '{}' order by in_date desc".format(stock3); curs.execute(sql) rows = curs.fetchall() price_three = [] for i in range(len(rows)): price = int(re.findall('\d+',str(rows[i]))[0]) price_three.append(price) mpl.rcParams['legend.fontsize'] = 10 fig = plt.figure() ax = fig.gca(projection='3d') #x 축은 0,1,2 고정 x1 = np.zeros(len(time),dtype=int) x2 = np.zeros(len(time),dtype=int)+1 x3 = np.zeros(len(time),dtype=int)+2 # y축은 시간 # z축은 가격 ax.plot(x1,time,price_one, label=stock1) ax.plot(x2,time,price_two, label=stock2) ax.plot(x3,time,price_three, label=stock3) ax.legend() plt.show()
- 같은 결과이지만 재사용 가능하도록 약간의 리팩터링을 했습니다.
pgsql
pgsqlimport re import pymysql import matplotlib as mpl import matplotlib.pyplot as plt import matplotlib.font_manager as fm import numpy as np stock = ['현대일렉트릭','동부건설우','SBS'] # 라벨 한글깨짐 방지를 위한 폰트 설정 fm.get_fontconfig_fonts() font_location = '/System/Library/Fonts/Supplemental/AppleMyungjo.ttf' font_name = fm.FontProperties(fname=font_location).get_name() mpl.rc('font', family=font_name) mpl.rcParams['legend.fontsize'] = 10 # DB 정보 설정 db = pymysql.connect(host='localhost', user='root', db='python', password='python', charset='utf8') curs = db.cursor() # 정보를 받아온 횟수 totalNum에 기록해서 time 배열만들기 sql = "select count(*) from stock where s_code = '105630'"; curs.execute(sql) rows = curs.fetchall() for i in range(len(rows)): totalNum = int(re.findall('\d+',str(rows[i]))[0]) time = range(0,totalNum) # stock 이름에 맞는 종목 검색해 가격변화 priceArr 배열에 기록하기. priceArr = [] for i in range(len(stock)): sql = "select s_price from stock where s_name = '{}' order by in_date desc".format(stock[i]); curs.execute(sql) rows = curs.fetchall() arr = [] for i in range(len(rows)): price = int(re.findall('\d+',str(rows[i]))[0]) arr.append(price) priceArr.append(arr) fig = plt.figure() ax = fig.gca(projection='3d') #x 축은 0,1,2,... 고정 x = [] for i in range(len(stock)): x.append(np.zeros(len(time),dtype=int)+i) # y축은 시간, z축은 가격 # 그래프 그려주기 for i in range(len(stock)): ax.plot(x[i],time,priceArr[i], label=stock[i]) ax.legend() plt.show()
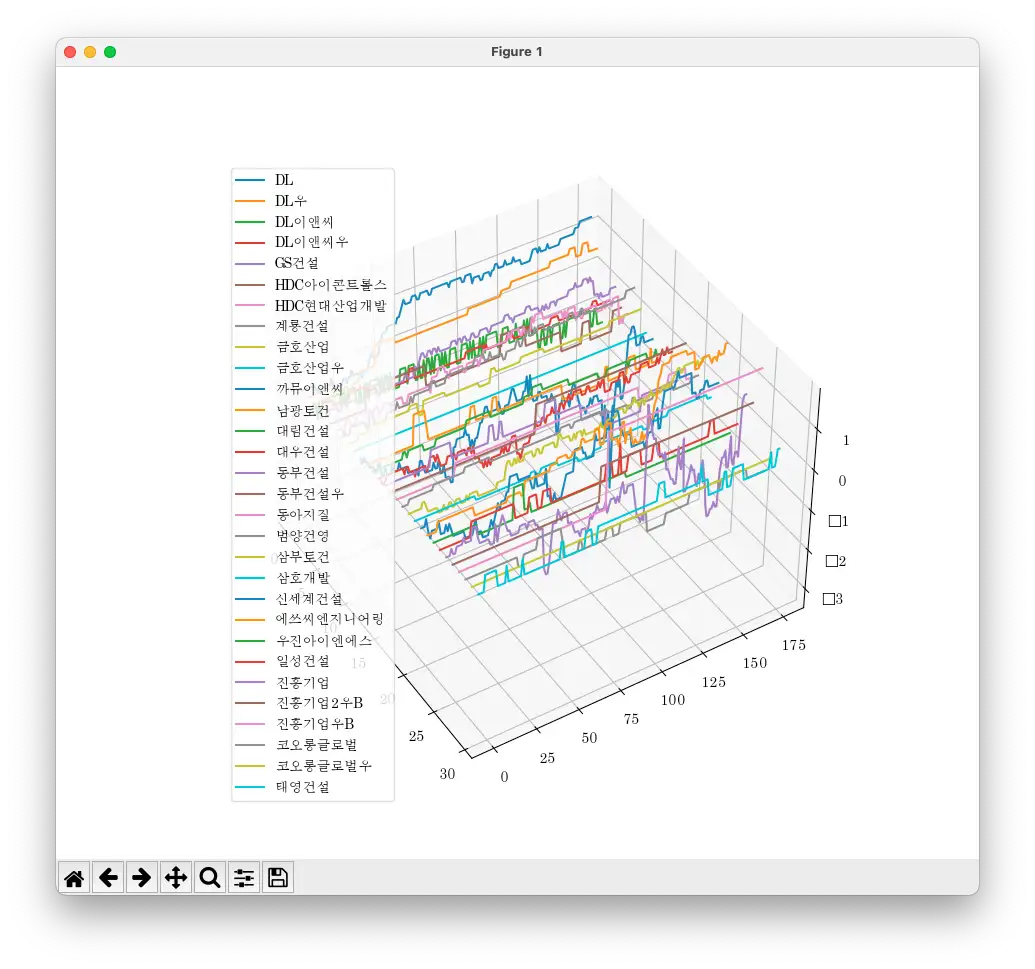
- 리팩터링 된 코드를 이용해서 stock 들 이름도 쿼리에서 받아 온 뒤에 반복문을 돌리도록 했습니다.
처음엔 800여개 종목 전체를 조회했는데 도저히 실행이 되질 않아서 줄여보니 30개 정도가 적당했습니다.
nix
niximport re import pymysql import matplotlib as mpl import matplotlib.pyplot as plt import matplotlib.font_manager as fm import numpy as np # 총 출력할 주식수 정하기. 너무많아지면 컴퓨터가 감당을 못해서 실행이 안됨. 40개 넘어가면 느려지고 70개부턴 거의 컴퓨터가 멈춘다. totalStocks = 30 # 라벨 한글깨짐 방지를 위한 폰트 설정 fm.get_fontconfig_fonts() font_location = '/System/Library/Fonts/Supplemental/AppleMyungjo.ttf' font_name = fm.FontProperties(fname=font_location).get_name() mpl.rc('font', family=font_name) mpl.rcParams['legend.fontsize'] = 10 # DB 정보 설정 db = pymysql.connect(host='localhost', user='root', db='python', password='python', charset='utf8') curs = db.cursor() # stock 이름들 받아오기 stock = [] sql = "select distinct s_name from stock"; curs.execute(sql) rows = curs.fetchall() cnt = 0 for stockname in rows: stock.append(str(str(stockname))[2:-3]) cnt += 1 if(cnt==totalStocks): break # 정보를 받아온 횟수 totalNum에 기록해서 time 배열만들기 sql = "select count(*) from stock where s_code = '105630'"; curs.execute(sql) rows = curs.fetchall() for i in range(len(rows)): totalNum = int(re.findall('\d+',str(rows[i]))[0]) time = range(0,totalNum) # stock 이름에 맞는 종목 검색해 가격변화 priceArr 배열에 기록하기. priceArr = [] for i in range(len(stock)): sql = "select s_price from stock where s_name = '{}' order by in_date desc".format(stock[i]); curs.execute(sql) rows = curs.fetchall() arr = [] for i in range(len(rows)): price = int(re.findall('\d+',str(rows[i]))[0]) arr.append(price) priceArr.append(arr) fig = plt.figure() ax = fig.gca(projection='3d') #x 축은 0,1,2,... 고정 x = [] for i in range(len(stock)): x.append(np.zeros(len(time),dtype=int)+i) # y축은 시간, z축은 가격 # 그래프 그려주기 for i in range(len(stock)): ax.plot(x[i],time,priceArr[i], label=stock[i]) ax.legend() plt.show()
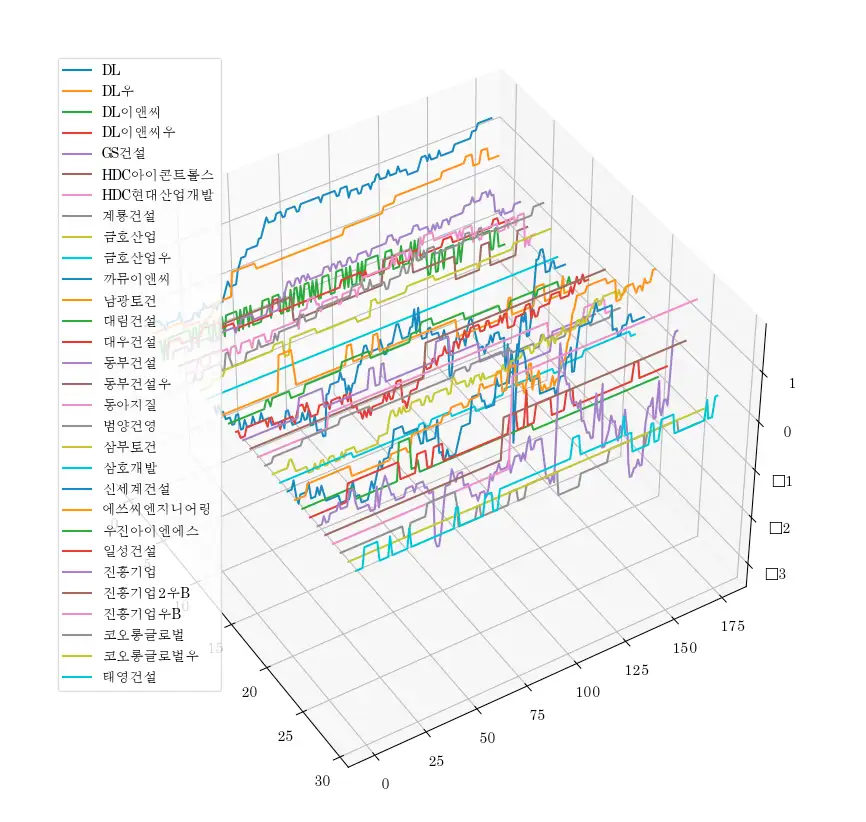
- 마지막으로 금액이 아닌 금액 변동 %를 z 축으로 사용하도록 조금의 변경을 했습니다.
nix
niximport re import pymysql import matplotlib as mpl import matplotlib.pyplot as plt import matplotlib.font_manager as fm import numpy as np # 총 출력할 주식수 정하기. 너무많아지면 컴퓨터가 감당을 못해서 실행이 안됨. 40개 넘어가면 느려지고 70개부턴 거의 컴퓨터가 멈춘다. totalStocks = 30 # 라벨 한글깨짐 방지를 위한 폰트 설정 fm.get_fontconfig_fonts() font_location = '/System/Library/Fonts/Supplemental/AppleMyungjo.ttf' font_name = fm.FontProperties(fname=font_location).get_name() mpl.rc('font', family=font_name) mpl.rcParams['legend.fontsize'] = 10 # DB 정보 설정 db = pymysql.connect(host='localhost', user='root', db='python', password='python', charset='utf8') curs = db.cursor() # stock 이름들 받아오기 stock = [] sql = "select distinct s_name from stock"; curs.execute(sql) rows = curs.fetchall() cnt = 0 for stockname in rows: stock.append(str(str(stockname))[2:-3]) cnt += 1 if(cnt==totalStocks): break # 정보를 받아온 횟수 totalNum에 기록해서 time 배열만들기 sql = "select count(*) from stock where s_code = '105630'"; curs.execute(sql) rows = curs.fetchall() for i in range(len(rows)): totalNum = int(re.findall('\d+',str(rows[i]))[0]) time = range(0,totalNum) # stock 이름에 맞는 종목 검색해 가격변화 priceArr 배열에 기록하기. priceArr = [] for i in range(len(stock)): sql = "select s_price from stock where s_name = '{}' order by in_date desc".format(stock[i]); curs.execute(sql) rows = curs.fetchall() arr = [] firstPrice = int(re.findall('\d+',str(rows[0]))[0]) for i in range(len(rows)): price = int(re.findall('\d+',str(rows[i]))[0]) priceGap = price - firstPrice priceGapPercent = priceGap/firstPrice * 100 arr.append(priceGapPercent) priceArr.append(arr) fig = plt.figure() ax = fig.gca(projection='3d') #x 축은 0,1,2,... 고정 x = [] for i in range(len(stock)): x.append(np.zeros(len(time),dtype=int)+i) # y축은 시간, z축은 가격 # 그래프 그려주기 for i in range(len(stock)): ax.plot(x[i],time,priceArr[i], label=stock[i]) ax.legend() plt.show()
코드가 크게 어렵지 않아서 주석을 보며 따라해보시면 어렵지 않게 해보실 수 있습니다.
'Programming > Python' 카테고리의 다른 글
| pymongo와 BeautifulSoup 이용해서 python에서 크롤링 하기 (0) | 2021.03.22 |
|---|---|
| pymongo 이용 Python에서 MongoDB 사용하기, CRUD 예제 (0) | 2021.03.22 |
| python 이용해 3차원 주식 그래프 그리기(2) (1) | 2021.03.19 |
| Python에서 Selenium 사용하기 및 Error: “chromedriver” cannot be opened because the developer cannot be verified. Unable to launch the chrome browser 에러코드 해결 (0) | 2021.03.18 |
| python 에서 pymysql 이용해 mysql과 연결하기, CRUD 예제 (0) | 2021.03.16 |